Financial advisors have time and again advised investors on creating a Contingency corpus. In fact, one of the basic financial lessons we have learnt from our parents is, always save for a rainy day.
Unprecedented times of global pandemic, lockdown extending to almost 6 months, business shutdown, increasing job loss, have further demonstrated the requirement of having a contingency corpus. A contingency fund provides you with some cushion to fall back on in case of an unexpected income loss.
So how does one start? The first step is to determine the value of your Contingency fund. The average rule is 6 months of fixed expenses in case of single income household or 3 months of fixed expenses in case of multiple income households. Ensure you include your rent, maintenance, grocery and food bill, the education cost in any. In case of an ongoing EMI ensure at least 6 months provisioning even with multiple income households.
Now, once you have estimated the appropriate size of your contingency corpus, how does one go about saving for it and where should you invest the money? The instruments suited for investing the contingency fund is ideally which have high liquidity and focus on capital protection. As it is not the job of a contingency fund to earn a high return. The job of a Contingency fund is to be there in an emergency and should be easily converted into cash.
Contingency fund needs to be divided into multiple components, rather than treating it as one single chunk of money. Instruments like Liquid funds, Ultra short term fund, Fixed Deposits etc. are few of the avenues one could look at investing.
It is also suggested, to keep around 10 to 15 days of your expenses in hard cash at home. Because the emergency can also come in the form of a natural catastrophe, during which banks can remain shut and several ATMs not working.
Rest of the funds can be spread across Deposits and Mutual funds. Do remember as per revised SEBI guidelines, Liquid fund have exit load up to 7 days. Also, while selecting a Liquid fund or an Ultra short term fund ensure the fund has a high quality portfolio. A large portion must be in sovereign or AAA-rated papers and is not mandated towards chasing higher returns.
Do remember to de-risk your contingency corpus, reduce bank risk by spreading out your deposit in more banks and mutual funds also by investing in at least two fund houses.
Since we all know the need for a Contingency fund, why do investors still fail to provide for it or have insufficient funds allocated? One of the major causes is most of the time the investors cannot provide for the entire fund value at one shot and eventually end up not saving enough.
One of the strategy investors should opt for is systematic saving for Contingency Corpus fund too. One can start with a SIP into a liquid fund or ultra-short term fund, many liquid funds have provision for SIP into liquid funds too. Another option is starting a recurring deposit.
Thus, it is never too late to start provisioning for your Contingency fund, you can start small and build up towards the required corpus. Also, now that you are staying at home and are practising social distancing due to COVID-19, you can use this opportunity to save the money you would normally use on things like dining out, travelling to work, vacations etc toward your contingency fund.
As our Grandmother used to say, like an ant save for the rainy day.
Author
Sana Shaikh Volunteer – Wealth Management M. Sc. Finance NMIMS, Mumbai Batch of 2020-22 Connect on LinkedIn
If you have the stomach for stocks but neither the time nor the inclination to do the homework, invest in equity mutual funds
-Peter lynch
When we look at any investment avenue, we mostly consider three aspects–
Historical Returns
Risk / Volatility
Cost
Historical returns
We usually analyze the historic returns in short term (6months to 1-year), medium-term (1-3 years) and long term (>3 years) depending on the investment class and investment horizon. This analysis helps us to form the general expectation of returns over the holding period, disregarding the random walk theory.
Risk / Volatility
Here we compute the standard deviation or movement of returns around the average returns of an investment avenue. Consider two investment avenues, Investment A provides average returns of 15% with standard deviation of 5% and Investment B provides average returns of 20% with standard deviation of 15%
Which amongst the two is riskier?
Answer is investment B- Even though investment B provides higher returns, the potential risk is much higher. A standard deviation of 15% indicates that there is a higher probability of returns lying somewhere in the range of 5% to 35% whereas the returns of investment A can range from 10% to 20% which might be better for a risk-averse investor. The probability of generating returns below 10% is very low in case of investment A.
Apart from the standard deviation, R squared and Beta are also risk indicators that can be used.
Cost
Cost includes tax, transaction cost, brokerage etc.
Taxes on mutual funds can be classified into Stamp duty, Income tax and Security transfer tax
Consider equity- the Stamp duty is 0.015% and 0.003% for deliverable and non-deliverable securities respectively.
Income tax depending on tenor of investment there will either attract Short term Capital gains tax and Long-term capital gains tax.
STT i.e. security transfer tax which is applied on sale of security
Brokerage fees depends on broker person subscribes and services they require.
Costs – And how various costs are affecting your investments over the time. What strategies could use to maximize your returns from mutual funds?
Costs attached to mutual funds are –
Entry load
Exit load
Expense ratio
Taxes
To explain effect of this cost on your portfolio let’s take hypothetical example-
Initial Capital of Rs. 1, 00,000, average annual return of 15%, time horizon of 1, 3, 15, 40
1) Entry Load
It is charge you pay to buy/enter in mutual fund scheme. Which could be up to 2.25%. Entry load is now abolished by SEBI.
Illustration—
Entry Load
2.25%
Investment
100000
Invested
97750
ROI
15%
Value
ROI
1 Year
112413
12.41%
3 Years
148666
14.13%
15 Years
795398
14.83%
40 Years
26183662
14.93%
We can see that effect of entry load on investment in short term and long-term investment horizon. In short run it has more impact than in the long run.
2) Exit Load
Exit load is basically the load for redeeming your units and booking your gains before completing a fixed duration. It is like a penalty charged on exiting, before completing a fixed investment tenor or lock in period. Essentially an exit load in effect is not different from entry load in terms of returns. But unlike the example given above, in practice the exit load is leviable only for a fixed lock in period for which the mutual fund requires the funds. Hence exiting is recommended only after completion especially when the NAV returns are high and expense ratio is low. Usually liquid funds and guilt funds have zero to negligible exit loads given their portfolio and name
3) Expense Ratio:
It is the annual charges levied on the invested capital for financing all expenses.
AUM (Billion Rs)
Equity-oriented
Others (excl. Index funds, ETFs & FOFs)
0 – 5
2.25
2
5 – 7.5
2
1.75
7.5 – 20
1.75
1.5
20 – 50
1.6
1.35
50 – 100
1.5
1.25
100 – 500
Reduction of 0.05% for every increase of 50 billion AUM/ part thereof
Reduction of 0.05% for every increase of 50 billion AUM/ part thereof
>500
1.05
0.8
Total expense ratio of mutual fund scheme Source: SEBI Press release
Regular Plans:
Distribution plays a very important role in last-mile delivery of product and that is true for Mutual funds as an investment product too. It also requires proper distribution for it to reach its target customer. If they are sold through distributors, then there are extra fees levied on investors every year which act as commission for distributor.
Expense heads
% charge
Investment management fees
1.25
Trustee Fees
0.1
Audit Fees
0.01
Custodian Fees
0.01
Registrar & Transfer Agent Fees
0.15
Marketing and Selling Expenses
0.75
Investor communication cost and fund transfer cost
0.15
Other Expenses
0.08
Total Expenses
2.5
Example of breakup of typical mutual fund’s expense ratio of regular plan
Direct Plans:
A direct plan allows investors to invest directly in mutual funds without any intermediary. The benefit of it being that investors don’t pay extra distribution and marketing fees every year.
“SEBI has mandated mutual funds to compulsorily launch a direct plan for direct investments, i.e., investments not routed through a distributor, from 01 January 2013. Such a separate plan has a lower expense ratio excluding distribution expenses, commission, etc., and no commission is to be paid from such plans. The plan also has a separate NAV.”
Illustration – Breakup of any generic Regular Mutual fund
These are expenses that are deducted every year from assets under management. When we look at the above table, we can see that 0.75% is what you pay extra for regular plans every year. Passive funds are usually direct funds
When we look for expense ratio in short term it might not look major expense but small increase in expenses ratio will have drastic effect on your invested capital. We can observe that by below:
Invested Capital
₹ 1,00,000
CAGR
15%
Regular plan Expenses Ratio
2.50%
Direct Plan Expense ratio
1.75%
Years
Regular value ₹
HPR%
Direct Value
HPR %
Difference
1
1,12,125
12
1,12,988
13
863
3
1,40,964
40
1,44,242
44
3,278
15
5,56,592
456
6,24,390
524
67,798
40
97,29,673
9629
1,32,19,529
13120
34,89,856
This illustration clearly demonstrates benefits of investing in direct plan rather than investing through distributors.
The statistics given below show the growth in investments through a direct plan.
Some example of Mutual funds Regular vs Direct plan –
These are few points that should be kept in mind before investing in mutual funds. Other relevant aspects highlighted in bold over the article along with information on types of mutual funds and their costs will be explained in the following articles.
Author Harsh Shah Team Member- Alternative Investment (M.Sc. Finance, NMIMS – Mumbai. Batch 2019-21)
I remember my first introduction to finance. ‘Higher the risk, higher the rewards’ were the exact words uttered by the professor as the young minds were trying to contemplate the entirety of it. One brief explanation and all of us were satisfied with the answer. ‘If you want to move upward/earn high in life, you have to take risks’. Time and again we’ve heard versions of these words (if not the exact same thing) being thrown on us. These words then go on to shape students’ brains and most of the decisions that we take in our lives. Calculated risks are what they call it and that’s because taking unnecessary risks don’t make sense at all. Just like falling down a mountain is a way of descending but isn’t always a great choice. You may get to the destination faster but at a huge cost of life. Likewise, you can take a smooth road down the mountain which may take more time but it’ll get you there safe & sound.
Although not entirely false, sometimes it is better to not take risks. This behaviour is explained in behavioural finance by the concept of Low-risk anomaly. The concept takes the high risk/high return concept and dumps it in the garbage. Okay not so dramatically, but what it does say and in most cases, prove, is that even with low risk, one can achieve high returns or better, even generate alpha over high-risk stocks. This just undermines the whole CAPM theory. A number of studies in the field have shown that this strategy has worked in most of the developed economies and so this strategy has caught the eyes of investors everywhere.
Seeing
its popularity grow in the US, NSE even launched a Nifty Low Volatility (LV) 50
index on November 19, 2012, comprising 50 of the least volatile stocks out of
the top 300 companies listed on the NSE. Similarly, launched on July 08 2016
came the Nifty100 LV 30 consisting 30 of the top 100 least volatile stocks.
Along with it NSE also launched the Nifty High Beta 50 index with just the
opposite outlook but with the same expectations. Since these indices have been launched
recently, the 5 and the 10 year returns calculated below have been back-tested
to get the annualised returns.
A
look at the 10-year return of both these indices and comparing them with the
benchmark NIFTY 50 will give some pretty disappointing results for high-risk
takers. Forget high returns, the Nifty High beta 50 didn’t even give positive
returns to its investors while the Nifty LV 50 beat the benchmark with
comfortable margins. Both the Nifty100 LV 30 and Nifty LV 50 have had similar
returns
Five year returns tell us the same story with the high beta index still not giving any returns at all. A quick glance at the graph will tell us how similarly both the LV indices move over a long term horizon.
The
three-year returns tell us a different story wherein our LV indices haven’t
able to beat the index. Some good news for the high beta 50 index but still,
returns are in single digits while nifty has given fantastic returns at 20.7%.
Notice how similarly the benchmark index and the LV indices move.
For
the last year comparison disappointment continues for the high beta index with
the most negative returns at 16.5% while the LV indices manage similar returns
at around 5.5%. Benchmark still beats every index with double the returns of
its nearest competitors.
It
is important to note that all the constituents of Nifty100 LV 30 are
overlapping with Nifty LV 50 i.e. all 30 companies in the former are a part of
the later index which probably explains the similarity of returns between the
two indices. NSE hasn’t cared to explain the reason for introducing LV 30 index
as there isn’t much of a difference between the two apart from the number of
index constituents. The only real difference to note is that the former chooses
from a list of top 100 while the latter chooses from a list of 300 stocks with
the highest market cap on NSE.
BSE,
too, wanted a piece of the pie and launched its own S&P BSE Low Volatility
Index on December 03 2015. The index comprised 30 of the least volatile stocks
in the S&P BSE LargeMidCap as measured by Standard deviation. There is no
high volatility index to compare it with. Keep in mind returns of both these
indices are Total Returns (TR) which basically means that dividends, if any,
are reinvested in the index as & when distributed by the company.
Calculations for the BSE LV TR index have been
back-tested as the index was launched in 2015 and so the returns are
hypothetical. The low-risk strategy has worked in our favour providing
comfortable margins over and above the benchmark BSE SENSEX.
Looking at the image below aligns with our previous findings of the LV indices at the NSE. Only 5Y and 10Y returns have beaten the benchmark (remember these returns are hypothetical since the index launched in Dec 2015). The LV index hasn’t actually beaten the benchmark since it launched as seen in the 3Y and the 1Y returns. 28 out of the 30 stocks in the index are the same as NSE LV 50 so there are no surprises here.
From the above findings, we observe that the LV strategy hasn’t really worked for short and medium-term returns but rather for the long term (5+ years). Most of the results are hypothetical since none of the LV indices were launched 10 years ago. Thus, it is only to be seen in the years to come whether the indices will hold up to the expectation resulted from success around the world or we’ll see another case of a gap between expectation and reality.
Disclaimer: This is not to be considered financial advice in any manner. Do your research before investing in any of the mentioned assets. Our work is limited to educating the readers regarding the same. I just wanted to check the degree to which the concept of low-risk anomaly works.
It’s an age long debate as to which is considered to be better in terms of an Investment Avenue. While both happen to be reasonably good options, due to its inherent nature, a lot of times ETF’s and Mutual Funds can be used interchangeably. In reality however, it is important that these asset classes have their own nuances that make them inherently different. In our innaugral post at Finvert, we will break down how these two securities are different and what are the things an investor should consider whilst investing in any one of the two.
What are ETF’s (Exchange Traded Funds)?
As the name suggests, an ETF tracks a particular index and allows the investor to buy the entire index as it were a stock. An ETF is therefore listed on an exchange and requires a Demat account for buying and selling of the fund. This lead to the name, ‘Exchange traded fund’. Due to this, ETF returns do not significantly vary from the overall market performance. ETF’s makes an ideal investment opportunity for Investors looking to beat inflation and expecting standard market performance based on historical data. The main attraction of an ETF is an overall lower turnover and expense ratio. These factors have contributed to high popularity enjoyed by ETF’s in the U.S. but not so much in India. The size of ETF’s in India seems poultry when compared to the AUM (Asset Under Management) of the countless mutual funds on offer in the market right now.
What are Mutual Funds?
Mutual Funds are a collection of a pool of money from different investors creating a fund which is actively/passively managed by a fund manager whose primary aim is to beat the returns offered by the stock market. Mutual funds can invest in various securities including stocks, commodities or bonds. A fund manager routinely changes the asset composition multiple times in a year so as to get the desired returns. This means higher turnover and hence, high expense ratio. Price is calculated daily at the end of the day based on fund performance. The entire money invested is then converted into units and sold for money.
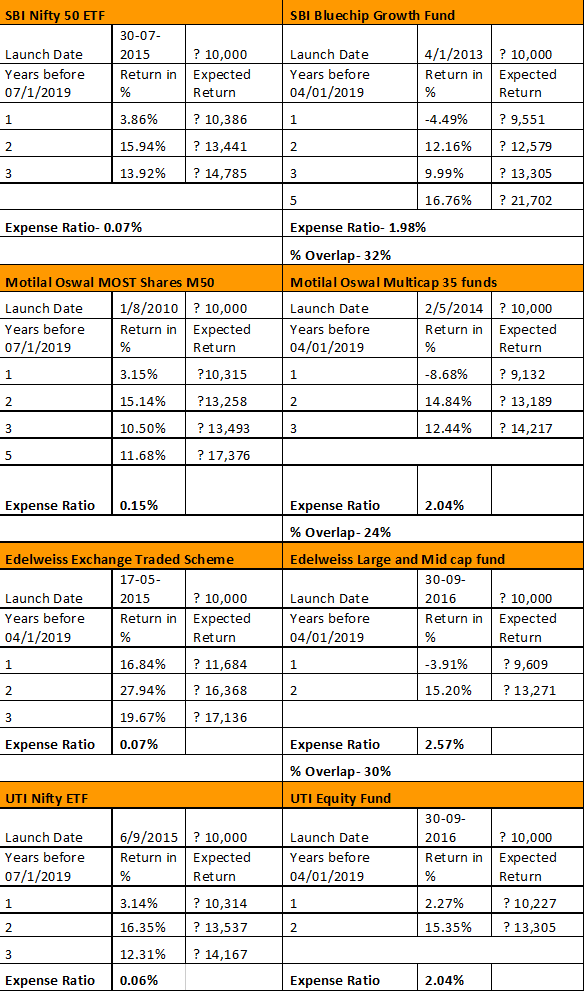
Mutual funds have burgeoned in terms of popularity in India due to the fantastic returns offered by the same in the past few years. Here we have taken some of the high performing ETF’s and Mutual funds of well-known fund houses and analysed the fund on various factors which include its returns, the expense ratio, percentage of stocks that are overlapping, etc. For a more like-to-like comparison, an ETF and a large-cap mutual fund is selected from the same fund house. Likewise, five ETF’s and five mutual funds are selected for the purpose. The returns calculated are rolling returns and also states the expected amount return when 10,000 are invested in the said scheme.
Comparing a year’s return between
securities is too short a term to perform a comparison. A three or a five year
term is enough time to perform a comparison. Looking at the table, the most
important distinction between the two is expense ratio. Where mutual funds
generally charge anywhere around 1.75-2.5%, ETF’s get away with 0.05-0.15% as commission
charged due to its passive nature. Add to that the turnover ratio (number of
times stocks are bought and sold) of a mutual fund is high which also increases
the overall expenses of the mutual fund. Things become interesting when tax
comes to picture. Essentially, mutual funds are taxed yearly whereas capital
gain tax on ETF’s can only be taxed when they are sold.
Overlapping of stocks in the security portfolio is another interesting thing between an ETF and a mutual fund. For eg., ICICI Prudential Nifty ETF and ICICI Bluechip fund direct growth have 74% of the stocks in their kitty that are similar. So ideally the returns for the same should match to a certain extent and that is very much the case for a 3 year period. But the mutual fund at 15.77% still manages to outperform ETF at 12.91% in the long term five year period. Another
The most important purpose of any investment is the returns generated and this is where mutual funds outperform ETF’s most of the time. The return is high but when factors such as expense ratio, stock turnover and tax come to picture, both the securities seem to offer similar returns. In some cases, ETF’s actually outperform mutual funds which question the whole idea of alpha generation in mutual funds in the first place.
While all this may look like a good picture for ETF’s, the reality is that ETF’s fail miserably in one important factor for any investor viz. which is liquidity. While mutual funds have grown to be very popular in India, ETF’s are very new and minuscule in comparison. So whilst the buying aspect may not be a problem, selling an ETF might be. So the investor needs to be cautious of this fact beforehand. But this being the stock market, no word is absolute and so both the options are to be considered by the investor while looking for an asset class to invest in.
This is not to be considered financial advice in any manner. Do your research before investing in any of the mentioned assets. Our work is limited to educating our readers regarding the same.