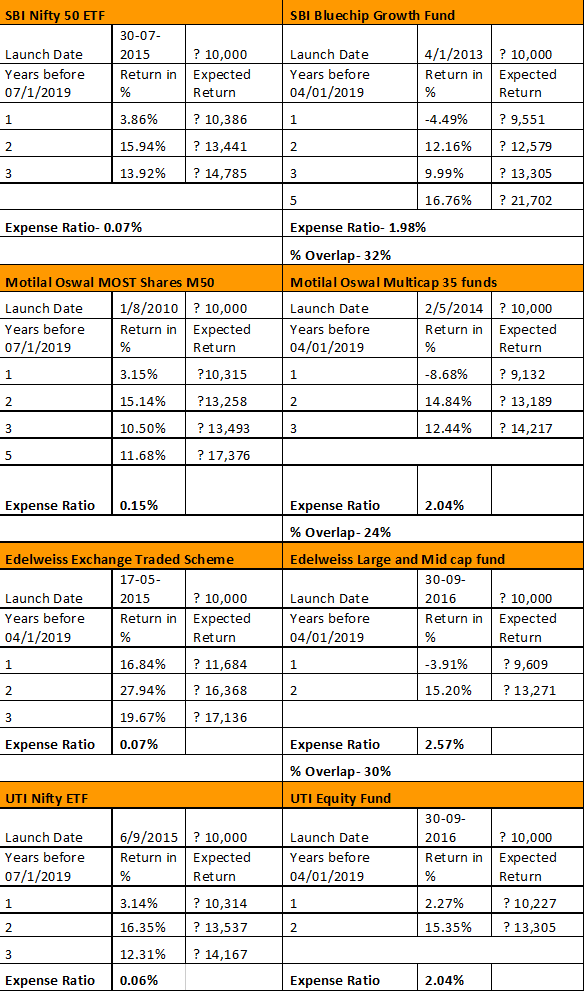
A Company Analysis Report
Asian Paints Ltd., the leader of the Paint & Varnish industry trading at CMP 1400 (as on 07/02/2019) has been one of the most attractive script for the investors. Despite being trading at a Price-to-Earnings Ratio of 69.45 (whereas industry’s P/E is 44.72), the investors and broking houses are bullish about the performance of the market leader of the Paint & Varnish Industry. Having seen the performances and investors’ action against the traditional market policies over the past few years makes Asian Paints an interesting case to analyse.
ABOUT THE COMPANY
Asian Paints Ltd. is one of the most prestigious company which has been present in the market for over 75 years and having a group revenue of over USD 2.5 billion p.a. Built on the principles of providing a distinct service of paint solutions and kitchen & bath segment through constant innovation & diversification. The company works towards providing exceptional spectrum of Inspiration-Customisation-Execution service to its customer base. The company is the largest supplier in the market having nearly a significant 55% of the market cap of the country due to its conscious effort of building customer relations over the years.
PAINT INDUSTRY ANALYSIS
Asian Paints has been able to capture more than half of the market over the years. The direct competitors for Asian Paints in the market are Berger Paints India Ltd, Kansai Nerolac Paints Ltd & Akzo Nobel India Ltd. However, none of the companies has achieved the scale & diversity and the market cap as Asian Paints has over the years. The whole of Paint Industry has witnessed a steady cumulative growth of 7% Y-o-Y over the course of last 5 financial years. While Asian Paints has been able to outperform the industry and has posted a significant 10% Y-o-Y growth in the similar period surpassing the global growth trend as well as Indian growth trend of 3.7% and 6.9% respectively. With the kind of economic and infrastructure growth and development the country has been witnessing over the years which has laid the platform of the scope of development and prospect of future opportunities. This has provided a positive outlook to the industry as a whole.
STRATEGIC PLANNING- PRODUCT LINE & GEOGRAPHICAL SEGREGATION
The company’s product profile is mainly made up of paints & home improvements. It majorly consists of interior & exterior paints, wood finishes range, wall coverings, SmartCare waterproofing products, bath fittings, kitchens and wardrobes. Rainwater harvesting and water conservation schemes are also an area company is looking to expand on. The company has installed capacity of 12 lac KL p.a. in a total of 9 factories across India. Asian Paints has a very diverse consumer base ranging from housing homes to automobiles to hospitals to factories to corporates across the length and breadth of the country leading to large product portfolio. Asian Paints has separate store network in town to cater to their demands, flagship multi-category décor stores as well as dealer run painting service to provide the bouquet of products and services up on offer. The company has its presence on Global level with mergers with PPG Industry Inc, USA, Berger-Asian in the South East Asian countries, as well as newly acquired tie-ups in Sri Lanka, the Caribbean nations & Africa.
FUTURE PLANS
There are two huge factories being set-up by the company in Mysuru & Visakhapatnam with a combined installed capacity of 11 lac KL p.a. This is a clear positive indication by the company about their future plans and growth prospects. In the recent financial year out of Rs. 1350 crs of CAPEX, Rs. 1100 crs was attributed to set-up of these new plants. Being the flag bearer of the industry, the company focusses on providing premium paint solution through constant innovation via new technologies, innovation & solutions and that has been seen through growth of Research & Development. Dream home concept, Colour ideas, personalised virtual home re-imagined solution on the electronic devices with technical assistance are the ways company has imagined and planned to moving ahead in the period.
FINANCIAL ANALYSIS & PROJECTION
- Asian Paints, being the market leader is setting trends and benchmarks for the other companies. The company with all its expansion and diversification plans combined with the future opportunities is expected to grow at a rate of approx. 12% p.a.
- The Goodwill and reputation earned by the company in the market over the years is been reflected in its ability to maintain a highly efficient working capital cycle which indicates that it has been able to negotiate the deals and form credit policies effectively leading to quick conversion of cash back into the company. This trend is expected to be continued in the upcoming years and the net cycle is expected to be near 15 days.
- Despite of the expansion and diversification in the recent years and the plans for the upcoming years which has seen a large amount of capital expenditure being incurred, the Fixed Assets turnover ratio is expected to tick on the positive side marginally at 5.5 because of the company’s ability to generate the additional sale from the increased expenditure.
- Asian Paints has both secured as well as unsecured loans though of nominal amount. The interest cost hence incurred is negligible which allows the company to plough back its profits either to its shareholders or back into the business and are not flown out of the business.
- The company as it seems won’t be in need of additional funds either in form of equity from the shareholders or as debt from other financial institutions. At the projected rate with the current capital, Asian Paints will be able to double its current Reserves & Surplus as well.
- The Operating Expenses are assumed to be constant going ahead and no major change is expected in the current levels of expenses.
- The company has a huge amount of Cash reserves and surplus which can be used going ahead in the future which can be an alternative for external debt or dilution of shares when the need arises. The cash at hand consolidates the company’s strong position in the market and industry.
COST OPTIMIZATION
Asian Paints as the flag bearer of the industry and as benchmark standards have taken many steps in order to optimize cost and use of the resources. Measures such as reduction in specific electricity consumption, use of non-product fresh water consumption, water replenishment, reduction in specific hazardous waste disposal and electricity from renewable sources have been taken up by the company.
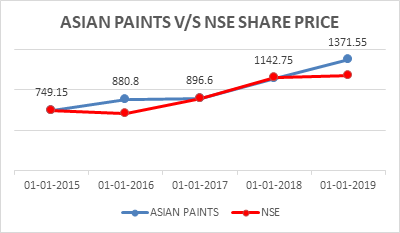
Asian Paints Ltd. has seen its share price almost doubled over the course of five years beating the benchmark average of Nifty 50. The company has seen a hike in the share price Y-o-Y in all the previous years. This has set a positive outlook for the upcoming years as well.
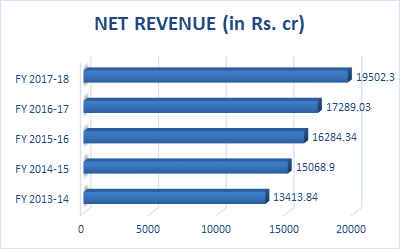
The company has revenue growing at Y-o-Y at a CAGR of 11%. This trend is expected to increase in the upcoming years with new opportunities in the current segment of the company with the expected revenue to grow at a much better rate which has been seen the results of first 3 quarters of FY 2018-19.
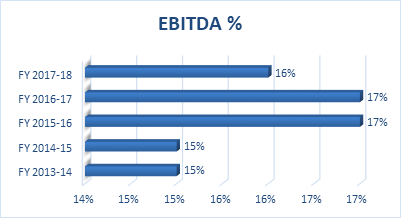
The EBITDA margins has seen a rise over the years and are expected to maintain and further continue this trend upwards till 18% which in comparison to the industries is pretty healthy. This indicates that the company is operating in a systematic manner over the years and is been able to replicate its performance despite of some uncertain events.
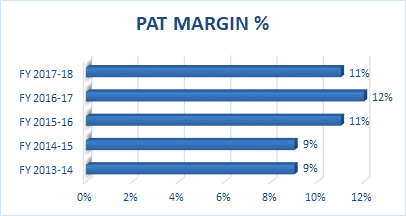
The company is quite comfortably able to churn the Operating Profit (EBITDA) into Shareholder’s earnings (PAT). This in turn indicates that the funds deployed by the shareholders are effectively been converted back to profits on a consistent basis which trend looks set to continue in the near future as well.
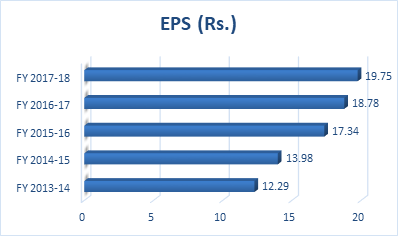
The Earning per Share of the company has increased over the period in line with the Sales of the company indicating that the rise in revenue is been reflected in the Net Profit. The company has even paid a fair share of this earning back to the shareholders in the form of dividends constantly.
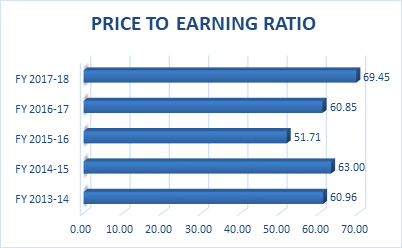
Asian Paints Ltd has had the highest P/E ratio in the industry throughout the years and still has managed to grab the investor’s interest over the years due to its fragile strength and capacity to dominate the current market with the Y-o-Y return generating capacity with the security of the investor’s funds. Hence commanding a huge premium on its price.
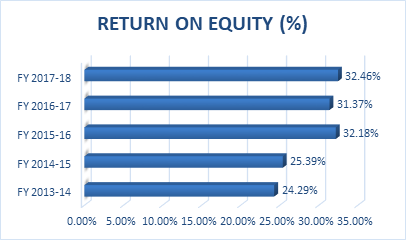
Asian Paints has been constantly able to generate a very high Return on the Shareholders funds deployed by them. An increasing trend in this percentages shows the efficiency of this almost debt-free company which is able to return the large chunk of profits back due to presence of negligible amount of debt on their books of accounts.
CONCLUSION
The fact that the company has been highly overvalued as on date by almost 270% as per projections and still is a hot-pick amongst investors and broking houses is well justified by its financial results and future prospects. With the real estate development, road network development, The SmartCity Project, Rural development combined with the Pradhan Mantri Awas Yojana (2024), Housing for all scheme and many more upcoming projects opportunities, Asian Paints being the market leader of the industry is expected to have a potential exponential comparative growth in the upcoming years ahead. The company also has a good dividend track report and has consistently declared significant dividends for the last 5 years providing the investors with return back year-on-year combined with the capital appreciation has led to a return greater than the market return.

Dhrumil Wani
Team Leader – Equity Research & Valuation
(M.Sc. Finance, NMIMS – Mumbai. Batch 2018-20)
Connect with Dhrumil on LinkedIn