Let’s start with, what is an Artificial
Neural Network?
An Artificial Neural Network or ANN is a software program that mimics the human brain’s ability to classify patterns or to make predictions or decisions based on past experiences. The human brain relies on inputs from the five senses, while the artificial neural network uses inputs from data sets. ANN have three or more layers of neurons. The first layer of neurons, called the input layer, has one neuron for each input to the network. Each neuron in the input layer is connected to every neuron in a hidden area. The hidden area occasionally consists of more than one layer, in which case each neuron in the first hidden layer will be connected to every neuron in the second hidden layer. The last layer in the hidden layer is connected to the outer layer. The strength of the connection between the various neurons varies with the weights allocated to each of the inputs. To start with a neural network, you would typically define a function that would map any value to a value between 0 and 1. This is called a “Sigmoid” function.
This function will be run at every neuron of our network, it is useful in converting probability out of numbers. Then after you add the input, you would like to seed them to make them deterministic as you would be adding random weights. Then you would add the synapses (synapses are the connection between each neuron in one layer to another neuron in another layer). Each synapse has a random weight attached to it. As you train this neural network, the error rate will go down as the allocation of weights which were initially random would autocorrect to a more accurate value.
Selection of appropriate inputs is one of the biggest challenges while designing a neural network. Selecting which inputs will impact NIFTY 50 is a relatively tougher job than selecting inputs for which mortgage application is most likely to default. Because both inputs and target outputs used in time series forecasting are very noisy (the data has a lot of random movement that has nothing to do with the trend). The data used in rating mortgage application are usually more generalized. If there is no income in that month, the person will default. However, in a time series forecast, the NIFTY 50 could go down today and come back up tomorrow and remain up for two months. Is it possible to claim that this fall in NIFTY 50 just noise? Credit Card customer search is another domain where neural networks are used because they require very specific customers to sustain. This ideal customer should spend heavily and not use revolving credit line. Hence, per card revenue will be below per card cost which will result in a lower breakeven point. This is crucial for a bank as the incidental & incremental exceed the revenue resulting in a non-profitable business. Therefore, implementing neural networks to distribute credit cards will maximize profits.
MJ futures claims that they achieved a return of 199.2% over a 2-year period using neural networks. Neural networks can identify trends in data that humans might not notice. For example, Dean Barr and Walter Loick at LBS Capital Management using a neural network with 6 inputs. One of these inputs is the ADX, which indicates the directional movement over the previous 18 days. Two more of these inputs are the current value of the S&P 500, and the net change in the S&P 500 value from 5 days prior. It has also been observed that with a network with 3 hidden layers and 20-40-20 neurons in hidden layers was the optimized network with an accuracy of 94.08% for validation dataset.
One of the most common mistakes that most traders make is taking Standard Deviation as their volatility in all their calculations. However, this is a backwards-looking figure and not an accurate anticipation of the future. To solve this figure an implied volatility could be used or volatility using an Artificial Neural Network. This was done in Shaikh A. Hamid and Abraham Habib’s paper on “Financial Forecasting with Neural Networks”, where they discovered that volatility forecasts as per ANN are more accurate than Barone-Adesi and Whaley (BAW) for pricing American options on futures.
They started by selecting
appropriate inputs. Technical price data on Treasury bonds was fed along with
fundamental data that also effects the market could also be added like fed
rates, GDP, money supply, Inflation rate, CPI& Inter-market inputs.
Then they moved on to
processing the input data by scaling it between 0 to 1 and normalizing the
data.
Specifying a network is the
next step. Therefore, they used a feed forward back propagation network. For
the input, they took 11 neurons and twice as many in the second layer (In total
there are 3 layers).
Then they trained the network
with enough historical data.
Author Neil Jha Team Leader – Fintech (M.Sc. Finance, NMIMS – Mumbai. Batch 2018-20)
If we look into the downfall of India’s GDP in 2008 and 2012 there was a huge downfall. And currently, it is also showing downtrend which can show us that in the near future there are chances of GDP going further down and some other indicators support the fall in this GDP.
There are some factors which are making us believe that there is a huge chance of recession in the near future.
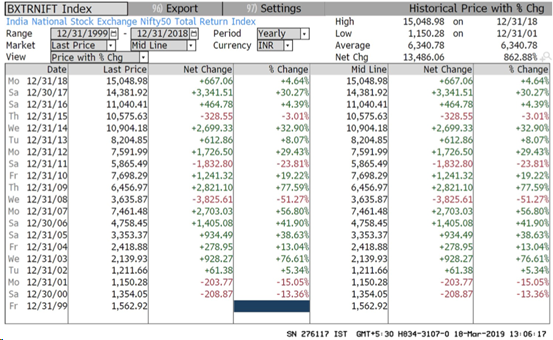
Nifty Returns
As we can see in the table below, there has been a reduction in the return given by the markets in the years when the GDP Growth rate is low. This clearly suggests the positive relation between market returns and GDP Growth rate
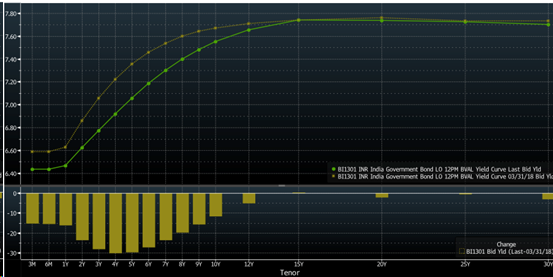
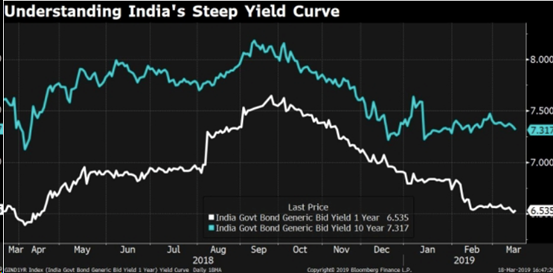
YIELD CURVE
If the difference between the interest short run and long-run interest rates starts to reduce, it means that the economic position is weakening. The yield curve is steeper for India and the growth rate of India is diminishing.
If we see the graph above, though the difference has increased it is presumed to converge in the near future and can lead to a slowdown in India’s economy.
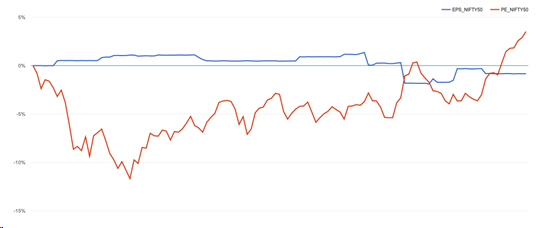
P/E and EPS
The red line indicates the P/E, P/E ratio has crossed the EPS line, this can be indicative that the index is overvalued and can fall in the near future. As in a period of 6 months, the market has been performing good but P/E didn’t cross EPS. So if the correction comes in the market there are chances of the market falling.
These are some of the indicators which may predict a slowdown in the recent future if the indicators tend to state the information in a similar way and do not diverges.
Unemployment Rate
According to experienced economists, the unemployment rate has been at 45 years high. In 2018, the unemployment rate rose to 6.1 %.
If we see, in the year 2008 the unemployment rate was at a maximum of 4.116%. Now it is way higher than the last few years. So this is one of the indicators stating the downtrend in India’s GDP in current and upcoming years.
Chances of war with Pakistan?
Since 1947 partition, India and Pakistan have come across there have been many reasons for conflict between India and Pakistan. There are huge chances of Indo-Pak war, because of ceasefire violation. On 14th Feb 2019, terror strike which lead to the death of 40 Central Reserve Police Force personnel were killed on Feb 14, 2019. After 12 days of Pulwana attack, India strike on Jaish-e-Mohammed on Pakistan soil which lead to a huge tension between India and Pakistan. This tension if continues can hamper the growth rate of India and somewhat indirectly contributing to the recession.
Oil Shock
Rebounding oil prices have pushed up oil import costs and will widen India’s currency account deficit. This will, in turn, weigh on the rupee, which is expected to depreciate further, economists say. India could overtake China as the world’s largest oil demand growth centre by 2024, according to a Wood Mackenzie report. Oil prices have shot up this year, and are set to go up further when sanctions on Iran kick in. The increase in oil prices and India being one of the largest importers of crude oil, can lead to an increase in the current account deficit and hence, contributing to the downfall in India’s GDP.
Author Apoorva Goenka Team Leader- Equity Research & Valuation (MSc Finance, NMIMS Mumbai. Batch 2018-20)
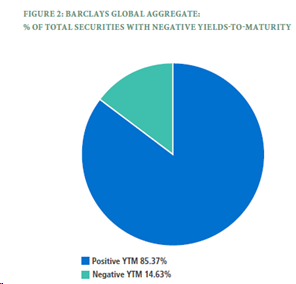
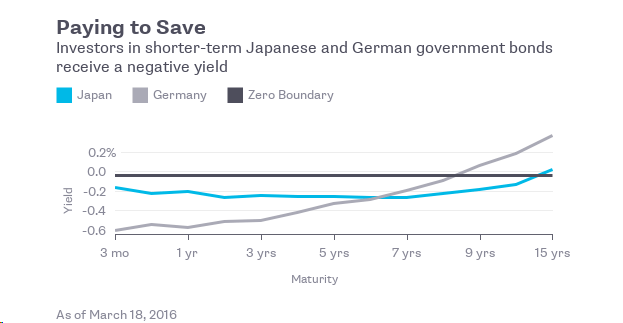
Is the Eurozone heading towards a fate similar to Japan with sticky disinflation, negative interest rate, asset purchase extravaganzas? Can we still generate positive returns from the European sovereign credit markets with relatively low risk, in such a negative yield environment wherein almost 14.63% of bonds have a negative Yield to Maturity (YTM) (Out of which 73% of negative YTM bonds have been issued by Western European countries such as Germany, France & by Japan in Asia)?
Source: Barclays, PIMCO
Source: Barclays, PIMCO
Active management of bond portfolios can help us effectively navigate through this negative yield environment and generate better than expected returns on our investments. In order to select the optimal active bond management strategy for the European sovereign credit market and to learn how we as investors can leverage the same, we need to understand the fundamentals of the economic prospects of the nations in the Eurozone and how they might be in the same boat as the BOJ.
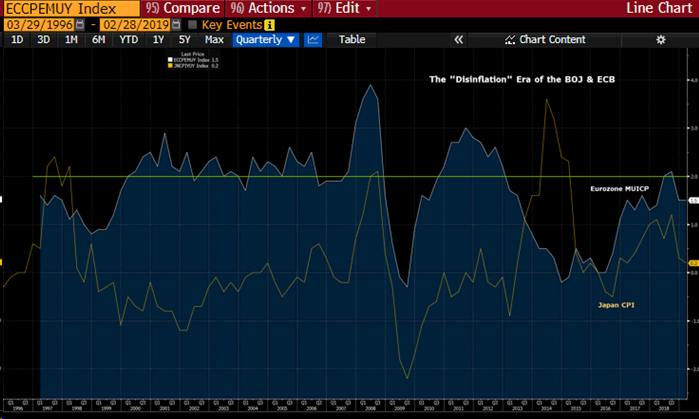
Both the European Central Bank
(ECB) and the Bank of Japan (BOJ) are struggling through sticky disinflation
with the CPI (Consumer Price Index) undershooting their 2% target for most of
the past decade. In order to prop up inflation to healthier targeted levels of
2%, the BOJ & ECB both have implemented numerous & sometimes even
outrageous policies which sound absurd at first such as negative interest
rates, asset purchases (equity & debt), loans at ultra-favorable terms
& last but not the least the “Yield Curve Control” by the Bank of Japan
(BOJ).
Let’s dig a little deeper to
understand how these policies affect the European credit markets and how can
use them to structure our trade.
“I want to
borrow money & want you to pay me for the same”
If I came to you with the above proposal, you would probably think I’m crazy to even think about it. For years, economists and central bankers have had to deal with the problem of Zero Lower Bound (ZLB) on interest rates, which in turn restricts the extent to which central banks can stimulate the economy by managing monetary policy by navigating interest rates.
To counter this problem, Haruhiko
Kuroda (Central Bank Governor, BOJ) & Mario Draghi (President, ECB)
implemented this novel idea of “negative interest rates”. Negative interest
rate here refers to the deposit rate i.e. the return banks get on their excess
reserves (IOER) parked with the central bank. The whole motive behind this move
was to disincentive banks from holding excess reserves and extend more credit
to the economy. They expected this policy to amplify expenditure, wages and
hopefully inflation. However, due to ageing demographics, low business
confidence, lower credit demand growth and shrinking bank margins, inflation
expectations have been consistently anchored below targets.
“Sir, what
would you like to buy today? Japan, please”
Since negative interest rates were struggling in the background, the central banks started buying financial assets such as equities & bonds from the secondary market in order to inject liquidity. The expectation was that if the central bank buys bonds from investors, investors will expend the cash received and there will be scope for higher inflation through higher spending as they likely won’t invest the proceeds in negative yielding instruments available within the country.
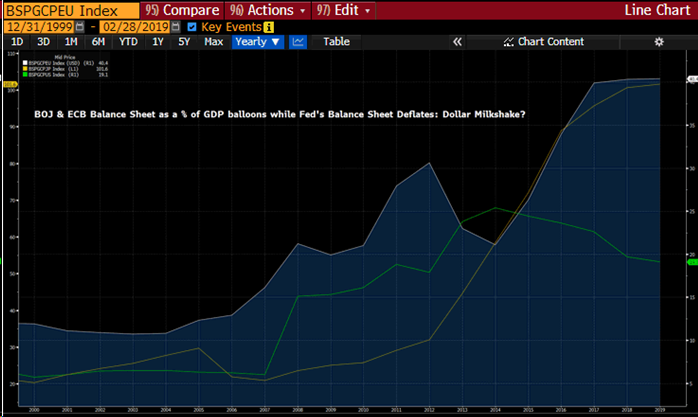
Balance Sheet as a % of GDP: Bloomberg
With these expectations, the BOJ (yellow)
ballooned its balance sheet away to as much as 100% of GDP! ECB’s assets as a %
of GDP (white) have also jumped from 20% to 40% in the last decade. So while
the ECB and BOJ were filling the glass (economy) with their rich milkshake (money),
the Fed (green) decided to switch off the tap and replace it with a straw. In
other words, most of the liquidity or money injected through the above policy
measures found itself gravitating towards the US which officially stopped it’s
balance sheet expansion and in fact started to “normalize it’s balance sheet”,
effectively withdrawing liquidity. This lead to lower spending in the European
economy and thus a muted inflation print. The phenomenon is also known as the
“Dollar Milkshake Theory”, but that’s a topic for some other post.
“Are you a
control freak? BOJ is.”
So
in order to have control over the yield curve (which in turn heavily affects
borrowing costs and thus spending & economic activity through credit demand),
you’ve flirted with negative interest rates, went on an extravagant asset
purchase spree, but nothing worked. So what do you do now? You not only control
short term borrowing costs but also the long end of the yield curve. BOJ anchored
the short end around -0.2% and the long end around 0% with a +/- 0.1% range by
claiming to buy unlimited quantity at the upper end, to keep interest rates low for long. They expected this
to maintain the steepness in the yield curve which could help soothe banks’
declining margins as they could now lock in a better spread. It would also
support asset prices and build consumer confidence.
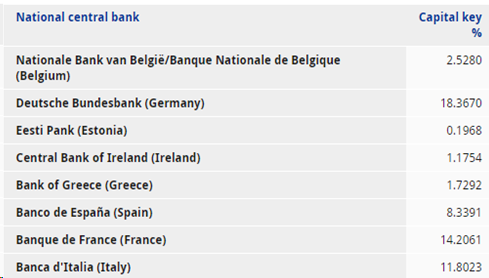
Japanese & German Yield curve: Bloomberg ECB’s Capital Key: % Allocation Breakdown (Source: ECB website)
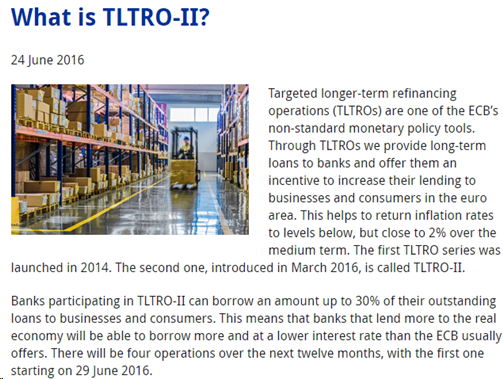
Now since Draghi has been following the footsteps of Kuroda and is probably in the same boat as him, he also might consider pulling a YCC trick out of his hat considering the end of his asset purchase program in December 2018. He even announced the launch of TLTRO-III (Targeted Longer Term Refinancing Operations) in the March 7, 2019, monetary policy review. Both of which, could help maintain an upward sloping yield curve and low yields.
The
biggest beneficiaries of the asset purchase program and TLTROs are usually the
nations which have the highest holding the ECB’s capital key with Germany,
France, Spain & Italy being the top contenders.
For those who aren’t aware of the TLTRO program, here’s a brief explainer from the ECB website.
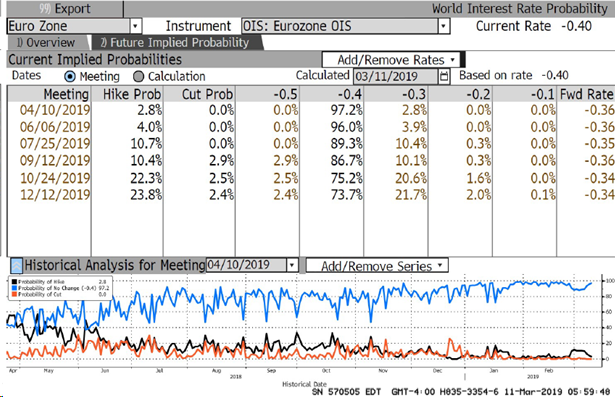
Since Germany is going to be one of the biggest beneficiaries of TLTROs as mentioned earlier, we can expect further easing in the nation, while interest rate risk from hikes seems to be subdued for the rest of the year. (Interpreted from the market-implied probability of interest rate changes).
Since
the setup for Germany is ready now, considering soft inflation, low-interest rate risk, upward sloping yield
curve & negligible credit risk (AAA rated), we can employ a strategy known
as “Roll Down” or “Rolling down the yield curve” to enhance our returns within
a short horizon of 1 to 3 years rather than just blindly accepting a 0% or even
negative YTM on short-dated bonds by just
holding them till maturity.
The strategy involves the purchase of a bond with a maturity in the higher yielding section of the yield curve and selling the bond prior to maturity when it reaches a lower yielding section.
Riding the Yield Curve (Source: Bloomberg, Balance Sheet Solutions)
The strategy can benefit investors by
providing:
1.
Higher incremental income: Purchasing bonds with a higher current yield
2.
Higher capital appreciation through liquidation: Depending on the
characteristics of the bond, a capital gain or reduced capital loss
3. Diminishing
bond price volatility: As the bond moves close to maturity, the duration
(interest rate sensitivity) of the bond also reduces.
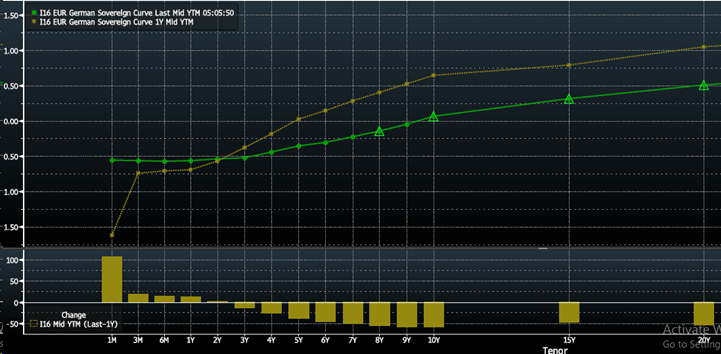
In order to demonstrate how effectively this strategy has played out in the past one year on the German Sovereign curve, we need to discover the steepest section of the yield curve as on 10th March 2018, which we shall roll down from.
German Sovereign Yield Curve as of 10th March 2018 (Yellow) & 10th March 2019 (Green): Bloomberg
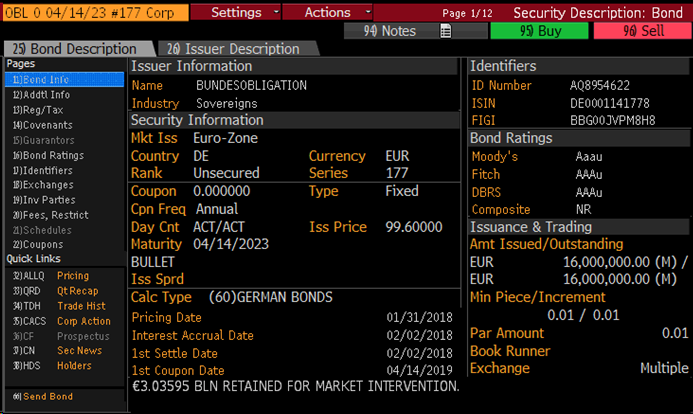
Just from eye-balling, we can deduce that the 5Y Yield at 0.008% and 4Y Yield at -0.23% seems to be steep enough for our strategy. So according to the strategy we buy the 5Y German Bund on 10th March 2018 with a YTM of 0.008% and 0% coupon at a price of €99.958.
5Y German Sovereign Bund, OBL 0 04/14/23: Bloomberg
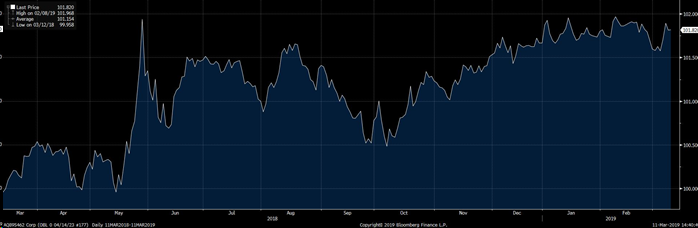
In our base case, considering no change in rates across the curve, the yield on this bond should slide towards -0.23% leading to a price appreciation of €0.992 or 0.9924% within a span of one year. However, due to changes in the yield curve, we may incur capital gains/losses. In our case, it is observed that the yield on the new 4Y German Bund has moved down further to -0.44%, leading to a total price appreciation of €1.86 out of which as we calculated earlier €0.992 is attributable to the roll down effect and the rest €0.87 gain is on account of the yields moving down.
German 5Y to 4Y Bund Price Movement (OBL 0 04_14_23): Bloomberg
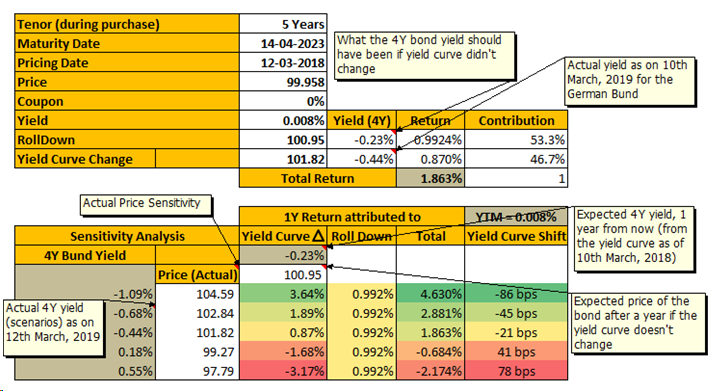
Adversely, yields could move higher if global growth picks up and inflation/IIP data delivers a shocker. We can model these scenarios for the next year by estimating the volatility of interest rates and running a sensitivity analysis of our total returns to these yield curve changes. This interest rate risk can then be effectively hedged with Out-of-the-Money (OTM) interest rate options, thus, locking in an effective gain of close to 0.9924% (after deducting the option cost).
Strategy’s sensitivity to interest rate changes (Source: Bloomberg, Author’s calculations)
As
we’ve seen with this example, it is possible to generate positive returns that
outperform the broader market by playing with the yield curve dynamics. As they
say, it’s all about finding positivity (returns) when you are surrounded by
negativity (yields).
Note: This information has been provided by Harsh Shivlani (Department Head, Fixed Income & Derivatives, Finvert) and is for informational purposes only. It is not intended to provide legal, accounting; tax, investment, financial or other advice and such information should not be relied upon for providing such advice.
Author Harsh Shivlani Team Leader– Fixed Income & Derivatives (M.Sc. Finance, NMIMS – Mumbai. Batch 2018-20)
Crowdfunding is an online
extension of financing from friends and family, communities to fund members
with some business ideas. The web-technology base used during the projects and
the conviction of ideas allows determining which project should receive funding
and how much funding should be received. Moreover, providing management and
technical assistance with real-time feedbacks on businesses. Crowdfunding makes
the entrepreneurs accountable and with the over-bust of social media they’re
marketing their ideas and raising funds thereon. A movement which has started
to move beyond the transcending boundaries, cultures and political barriers
giving fuel to entrepreneurial finance.
Crowdfunding has a long history embedded. Books have been crowd-funded for centuries as authors and publishers would advertise their books with the help of subscription scheme or praenumeration. The decision to publish a book would depend upon the readiness of the subscribers, the power of confidence among investors signaled the nascent stage for crowdsourcing. The concept of crowd-funding has been derived from crowdsourcing which describes the process of outsourcing tasks for ideas, feedbacks, asset, knowledge, resources, and expertise to develop and accomplish the purpose.
During a podcast by Wharton’s Valentina Assenova, he discusses the first noteworthy instance of crowd-funding that gained popularity. When government sources failed to provide funding for the construction of the Statue of Liberty, a newspaper led-campaign attracted small donations from 160,00,000 donors. In 2006, the “Free Blender” campaign which was an early software crowdfunding precursor aimed for open-sourcing by collecting $100,000 from the community while offering additional benefits led to the emergence of the concept.
Crowdfunding – widening
the purview
A report by worldwide
expert administrations firm PwC perceives the accompanying classifications:
Seed crowdfunding which is the utilization of “rewards-based”
crowdfunding. This subsidizes the creations where patrons pay forthright for an
item or venture. Value crowdfunding enables little and vast financial
specialists to buy little packages of offers. This gets a great deal of press
consideration – yet makes up just a little level of in general crowdfunding. Donation-based crowdfunding which is used to
assist in networking activities.
“Crowdfunding is a democratized funding”
– Jonah Berger
Regardless of whether it
is crowd-sourcing or crowd-funding platforms, both have commission-based plans
of action benefiting (commonly 4 – 7.5%) from each effectively supported battle
on their stage. Crowd-funding platforms have the additionally preferred
standpoint with the capacity to take a value stake in effectively subsidized
organizations. However, by and large, the entire plan of action for group-based
venture stages is driven by exchange volume. The entire group subsidizing
industry, which is in quick development mode at the present minute, is entering
a period of the combination. The fragile stages that can’t drive the essential
volume through their stages are leaving the business, whereas the grounded
stages are extending their market nearness and developing their task-based.
Continuing in the matter of crowdfunding the stages need to pursue the model or
exit.
The main question here is
“Can India Leapfrog”?
In a country like India
innovation, creativity and invention arguably have no funding available on its
side especially if the reach of technology is limited. Further, the lack of
transparency and accountability with the use of funds for a purely creative
project impedes the sustenance. The other problem is the number of funds
required. It is here that crowd-funding comes to the rescue. Helping these
unconventional innovators and entrepreneurs bridge this gap in India is
Wishberry.in, a Kickstarter-inspired crowd-funding platform.
Another astounding model is Exploride,
Asia’s largest crowd-funding project in Kerela that has set a record in the
group subsidizing history of Asian startups. The organization’s Indiegogo
battle crossed the underlying target of $100k in only five days and has
achieved an incredible $500k mark in 40 days of its dispatch. Exploride’s
campaign has been upheld by 1,800 individuals from more than 50 nations over
the globe with the greatest number of pledges originating from the USA.
With all the development of the
diverse stages and tasks, SEBI discharged a research paper in the year 2014 in
regards to the proposition giving proper structures to raising of assets by new
businesses and SMEs. Crowdfunding could expel obstacles and made the move from
conventional account to present day financing. In 2016 SEBI issued a public
statement titled “SEBI Cautions Investors” which secured issues
relating to the financial exchange and with more than 200 investor’s, the stage
can begin going about as a trade. The delaying of the legalization of
equity-crowdfunding as every investor expects a return on investment and
framing a proper grievance redressal system is paramount.
The power of crowd-funding applies to
projects relating to any field, any amount or any location. Crowd-funding is a
viable option and a constant proposed regulation accepted by the Government
making it an appealing and desirable option. Looking at the global emergence of
crowd-funding there are many pros and cons associated with it. Taking the right
steps to encourage crowd-funding will be a boon to many, the different types of
models and power of communication make it even easier for start-ups and SME’s
to raise finance. The need of the hour is to identify its abundant potential
and tap it in this nascent stage.
Author Anushka Chordia Team Member– Alternative Investment Funds (M.Sc. Finance, NMIMS – Mumbai. Batch 2018-20)
The name Alternative Investment suggests investments which aren’t traditional by nature and it differs not only in types of asset classes but also the structure of the investment vehicle. On comparing Alternative Investments with Traditional Investments, we can notice that –
Alternative Investments have less liquidity of
assets.
It requires specialized investment managers.
They are more concerning since there is no
historical data on return and volatility data.
They have different legal issues and tax
treatments.
But in spite of the above stated issues, Alternative
Investments Funds (AIF), a part of Alternative Investments is on the rise in
India. Alternative Investment Funds refers to privately pooled investment
funds, either from Indian or foreign sources. AIFs were allowed by SEBI in 2012,
and by end of 2013, there were 84 registered AIFs in India.
When we look at the year 2013, India was ranked 9th
by the Global Limited Partner Survey of ‘Emerging Markets Private Equity
Association’ for the ‘most preferred
destination’ by global investors. Fast forward to 2017, India has been
ranked numero uno in the same
category. This upward climb on the ladder can be attributed to the rise of AIFs
in India from 84 registered AIFs in 2013 to 517 in 2019, more than a six-fold
increase.
Relation between AIFs and Indian Economy
According to SEBI, AIFs are classified in 3 broad categories –
Category I– These AIFs invest in startups, early stage ventures, infrastructure, SMEs or any area which the government and regulators think are socially and economically beneficial. Category 1 AIFs include Venture Capital Funds, SME funds, Infrastructure funds etc.
Category II- The AIFs which don’t fall in category 1 and 3 are the part of this category. These mainly include Private Equity funds, Real Estate funds et al. These funds don’t take leverage or borrowing for their operational requirements.
Category III- The AIFs which use complex trading strategies and employ debt including through listed or unlisted derivatives fall under this category. Hedge funds, PIPE funds et al are to name a few.
AIFs offer High Net worth Investors (HNIs) and Institutional
Investors diversified portfolios which are not offered by the traditional
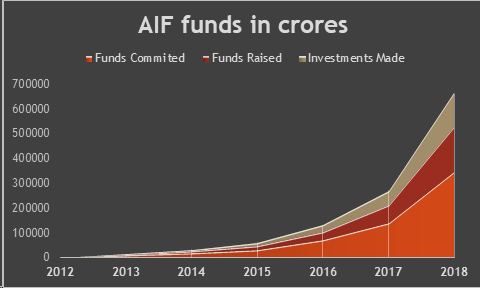
investment options. Over the period of last 7 years the funds raised and
invested by AIFs have been increasing year on year. This in turn shows the
growth of the Indian economy landscape. India being a developing country the
scope of investment in vast and the government is trying to make India not only
business friendly but also investor friendly which further increases the scope
for AIFs. AIFs invest in startups, SMEs, infrastructure, real estate etc. using
mutual funds strategies and by not taking long or a short position which helps
in direct capital infusion.
Over the years the Indian government has taken various steps
in favor of AIFs such as –
RBI issued a notification in 2015 wherein it
stated that AIFs having majority foreign capital will be considered as local
fund and FDI regulations won’t be applicable. This was under Automatic Route.
Category III funds are allowed to invest in
commodity derivatives.
Proper structure was put in place to avoid
double taxation for the Category I and II funds investors.
Government of India has set up National
Infrastructure Fund of INR 20,000 crores.
AIFs being illiquid by nature, but allowing them
to be listed on stock exchange help them to be traded easily. All AIFs expect
the open-ended AIF can be listed on the stock exchange.
Funds of Funds are the funds which invest in
multiple Category III funds. Although in India it’s still at a nascent stage.
From the above graph we can see the gradual but a steady
rise not only in the funds raised but also in the investments made by AIFs.
India being a young nation with a lot of untapped capital and has tremendous
growth prospects in the future and with such funds on a rise will not only help
to reduce the investment deficit of the country but also harness her growth
potential.
AIFs being diverse are able to meet the financial needs to
HNIs wherein they can choose between short term i.e. liquid funds and long term
i.e. physical assets or longer duration funds.
AIFs has low returns correlation with the traditional investment
products in longer period and aren’t as volatile as stock and bond markets
which helps to reduce the portfolio risk.
Although AIFs market is rapidly growing in India it is still paltry in comparison to the global AIF market. The regulators and Government have taken various steps in favor of AIFs there is still a long way to go from here. But the future does look bright.
Author Isha Khuteta Team Member– Alternative Investment Funds (M.Sc. Finance, NMIMS – Mumbai. Batch 2018-20)
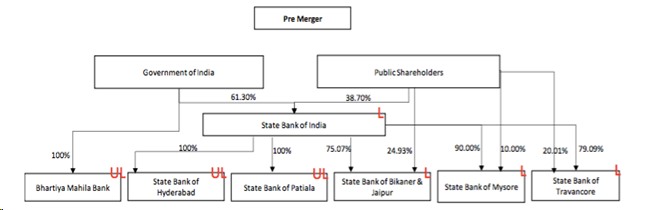
Public Sector Banks (PSBs) are banks where a government holds a majority stake i.e. more than 50%. Currently, there are 27 public sector banks in India. Out of these, 21 banks are nationalized and 6 banks are of State Bank Group (SBI and its 5 Associates) and the shares of these are listed on the stock exchanges. In India, out of the total banking industry, the Public sector banks constitute 72.9% share while private players cover the rest. However, PSBs seem to be losing their market share on account of the huge Non-Performing Assets. Banking industry is undergoing unprecedented changes driven by consolidation by means of mergers and acquisitions all over the world. In recent years, banking industry of India has witnessed a transformation as it was working in highly regulated environment before.
L= Listed; UL= Unlisted
OBJECTIVE
The objectives of the study are:
To analyze the impact on share prices of the company during pre and post-announcement period of the merger.
To see the resulting change in the value of the company after the merger.
To study the synergy effects of the merger
To analyze whether the mergers add value to the Indian Banking System in general and Public Sector in particular.
ANALYSIS
VALUATION OF BANK
As on March 31, 2017, the firm was undervalued even after the merger and increase in share prices. The rise in the share price was not huge and keeping the stock of SBI as undervalued.
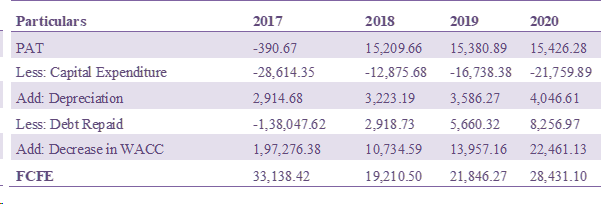
We have use FCFE method in calculation the value of Firm.
Assumptions-
The company is expected to grow at a high growth rate for 3 years. (SBI sees profit boost in 3 years after merger).
Growth rate of the firm is constant at 4.794%; it is calculated by growth in deposits of banking sector deposits.
Free Cash Flow To Equity= Profit After Tax – Capital Expenditure – Increase in working Capital + Debt Raised – Debt Repaid + Non Cash Expense
Before merger to calculate FCFE the sum of SBI with all the associates and BMB have been taken before merger so as to reduce the impact of errors.
Capital Asset Pricing Model (CAPM)
CAPM= Risk free Rate of Return +Beta (Market Return – Risk free Rate of Return)
Here, we have take 10 years monthly average of the Government of India Bond return for % years, which comes out to be 7.91%. (Annexure 1)Sensex average monthly return for 5 years comes out to be 11.889% (Annexure 1) and Beta of SBI is 1.3871 (Capitaline)
CAPM= 7.91%+ 1.3871 (11.889%-7.91%)
=13.429%
It is assumed that CAPM is the Present Value Factor and cost of equity of the firm.
DISCOUNTING OF FCFE
TERMINAL VALUE
Terminal value =
= 345049.4575
PV of Terminal Value = 345049.4575 X 0.60= 208442.968
Value of Firm = 284733.8107
MARKET VALUE
For market value of the firm we have taken the data as on March 31, 2017, the closing price of SBI and the number of total outstanding shares on that date.
UNDERVALUED
Value of firm – Market value = 284733.8107 – 233862.8853
= 50870.9254
SWAP RATIO CALCULATION
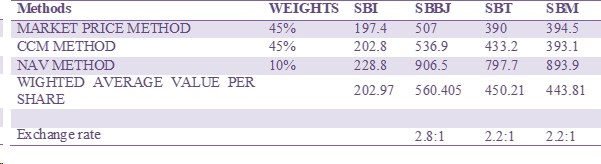
The company came out with Swap Ratio by analyzing three-weighted method in finding out the true value of its associates and making it a fair deal.
Three methods, which are, used are-
Market price method- It refer for determining the price of the similar items for determining the value of an asset. It is a business valuation method for determining the value of the business ownership. The weightage that was given to this method at the time of merger was 45%.
Completed Contract Method (CCM)- In this method, it enables the businesses to postpone their reporting of income and expenses until the contract is completed. This method can either under estimate the profit or over estimate it as there are contracts, which are not being accounted for till they are completed. The weightage given to this method is 45%.
NAV Method- This method focuses on the NAV of its total assets minus total liabilities divided by number of outstanding shares of the firm. This method was given a weightage of 10%.
The valuation of the company is done on the market value of firm as on 17 March 2017. The company came out with the Exchange rate of 2.8:1 for SBBJ, 2.2:1 in case of SBM and SBT. There was no Swap ratio for SBP and SBH as they were fully owned subsidiary of SBI and 4,42, 31,510 shares for every 100 crores shares of BMB.
(SES Governance)
CHANGES AFTER THE MERGER
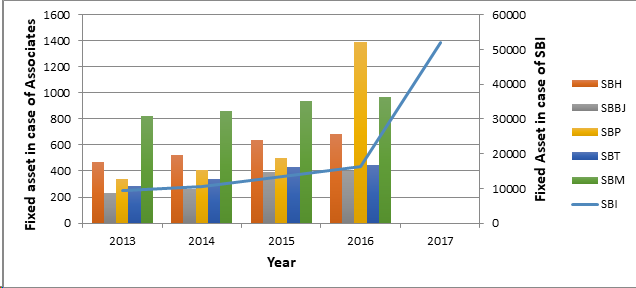
Fixed Assets
The fixed assets of SBI went up to Rs. 51,884.15 crores post the merger from Rs.16,200.90 crores pre-merger as all the fixed assets of the associate banks merged with that of SBI converting it into a larger public-sector undertaking in terms of assets. The major increase in fixed assets was because of increase in Premises of SBI from Rs. 6,505.14 crores to Rs. 42,107.57 crores. After the merger, SBI joined the club of top 50 banks globally in terms of size of assets. The number of branches increased to around 24,017 and ATMs managed by SBI was nearly 59,263 across the country. This will increase the area managed and covered by the bank directly rather through its associates with a wide range of products at lower costs.
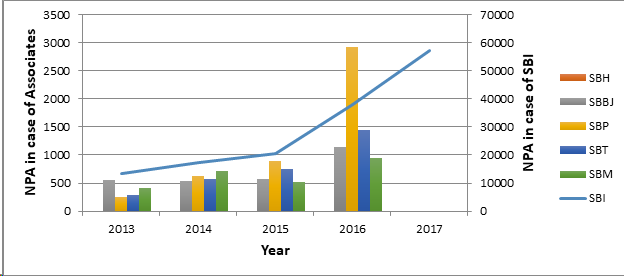
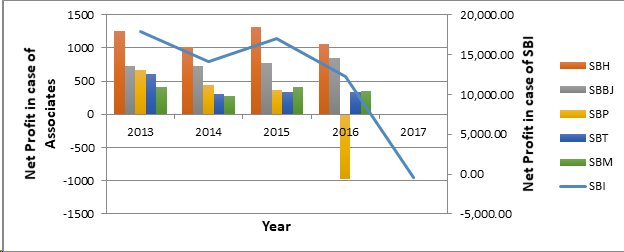
Net Profit and NPA’s
The net profit of SBI pre-merger was reported to be around Rs. 12,743.39 crores which was converted to a net loss of Rs. 390.67 crores post the merger due to integration of non-performing assets of SBI with all its associate banks. The NPA’s were reported to be at Rs. 57,155.07 crores compared to Rs. 38,024.06 before the merger. NPA’s of SBI increased by almost Rs. 19,131 crores which resulted in a great loss to SBI.
Out of all the associate banks, SBP had the largest amount of NPA’s of Rs. 2,924.03 crores and a net loss of Rs. 972.4 crores before the merger. While SBH reported the highest net profit of Rs. 1,064.92 crores with negligible NPA’s among all the associate banks. However, the loss incurred is of short-term nature and gradually with time, SBI will again start reporting profits as a result of economies of scale and reduction in costs of doing business.
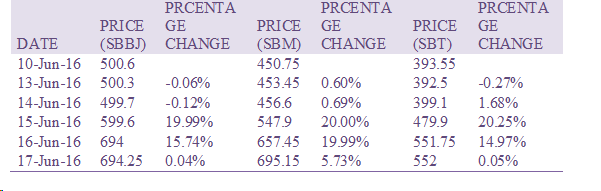
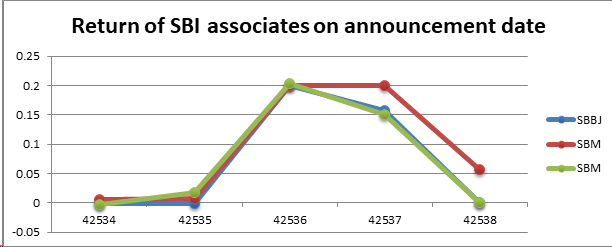
VOLATILITY IN SHARES
On the date of the merger, markets were bullish on SBI and its associate as SBBJ shares price rose by 20% for two consecutive days hitting the circuit on both days. SBM’s share prices also rose by 20% after the announcement of merger following a growth of 15.74% on the next day. In fact, SBT’s share too rose by 20% after the announcement of merger and further by 15% on the following day. SBI owns a market share of 23.07% in deposits and 21.16% in advances as opposed to 18.05% and 17.02% in deposits and advances respectively.
The combined bank now caters to around 42 crore customers. There exists a large scale of inefficiency among smaller banks which when merged into a larger bank would make it more efficient in carrying its operations.
POST MERGER
Post-merger, the total customer base of the bank has reached 37 crores with a branch network of around 24,000 and nearly 59,000 ATMs across the country. The employees’ strength of SBI has increased to a total of 2,71,765. All the customers and employees of SBI associate banks have become the customers and employees of SBI. So, all the employees are now eligible for the same retirement benefits as the SBI employees. That means, the SBI employees get three retirement benefits i.e. provident fund, gratuity and pension and the associate bank staff members get two retirement benefits.
The merged SBI Bank now has a deposit base of more than Rs 26 lakh-crore and advances level of Rs 18.50 lakh crore. The board of SBI approved the merger plan under which SBBJ shareholders would get 28 shares of SBI for every 10 shares held. For both, SBM and SBT shareholders would get 22 shares of SBI for every 10 shares. However, separate schemes of acquisition for State Bank of Patiala and State Bank of Hyderabad were approved by SBI. Since they are wholly owned by the SBI, there will not be any share swap or cash outgo and for BMB, SBI’s 4,42, 31,510 shares for every 100 crores shares of BMB
Author Apoorva Goenka Team Leader- Equity Research & Valuation (MSc Finance, NMIMS Mumbai. Batch 2018-20)
No matter what individuals are doing they
like to be in control of the situation, they like to know what is the risk
associated with it, and also is it worth taking the risk for the benefits that
come with it. Any rational person will not make any investments/choices
irrationally, one of the most important things investors consider while
deploying money in any security is checking the ‘Beta’ of that particular
stock. So what exactly is Beta, and is it really that important?
The beta (β) of an investment security (i.e. a stock) is a measurement
of its volatility of returns relative to the entire market. Beta is a measure
of risk and it allow people to be in control or at least makes them believe so.
Breaking Down Beta
The volatility of the stock by x percent
when the market moves by 1% is the beta of the stock. A stock with a high beta
will have higher volatility and vis-à-vis a stock with lower beta will have a
lower volatility. Beta is a good measurement of systemic risk in the market.
Systemic risk is the risk that can be not controlled by the company issuing the
security. The General measure for Beta is 1.
Calculating
Beta
Beta as I mentioned shows the returns that
the security will give when compared to the market. So running a regression on
co-variance of daily returns of the security with respect to the markets
divided by variance of daily market returns. You can easily do it by shooting
up your computer, going to Yahoo/ Google Finance and finding the daily price
table of the stock and the market and then putting it in an excel and using the
formulas of covariance and variance.
Applications
of BETA
Beta is used in calculating the
expected returns of the stock or portfolio in Capital Asset Pricing Model
(CAPM).
Beta of listed companies of the
same industry will help you find the beta of an non listed company while doing
valuations.
Beta of an industry will help
you identify potential industries to invest in on happening of certain events
In case of sensitive securities
with higher risks like options, the beta is a very important measure to assess
the risk and returns associated with it.
With all the good things that come with Beta, it cannot go without getting some criticism. In many cases it is seen that the security does not behave as it is supposed to behave in normal market conditions, hence making the use of beta more reliable or rather useless. Beta only captures the systemic risk of the company, the risk within the country cannot be measured using Beta. Also when the beta is calculated it is the raw beta for the company.
Raw Beta can be known as the historic beta of the company. This beta cannot be in line with the market beta because the company may be comparatively new and may not be diversified enough to absorb the shocks in the market. While calculating the beta on a Bloomberg terminal, the terminal also showcases an adjusted beta. This beta is the estimate of security’s beta in the future.
Adjusted
Beta = 0.67* Raw Beta + 0.33* 1
It is believed that in long run the beta
for any company will be near to 1, because the company may diversify and absorb
more shocks from the market. Therefore after assigning 1/3 of weight to 1 and
2/3 of weight to the raw beta we arrive at the adjusted beta. This method is
given by Bloomberg, however there is no justification given by them in regards
of weight allocation to adjusted and raw beta.
There is one more complication whilst calculating the beta. Beta can be calculated using monthly, weekly, daily or quarterly returns and also can be regressed against the index of our choice. There is no uniformity being followed as to which set of pair is to be followed as there are several permutations and combinations available. Bloomberg reports a standard beta for 2 year weekly data and for a US company it is regressed against the S&P 500 index, this is because S&P 500 is a broad index.
However, the logic is forgotten when reporting beta for an Indian company. Indian stock is regressed against BSE SENSEX, which is the index for securities with top 30 market capitalization in the country. This is done just because SENSEX has more correlation to the S&P 500. The best way to calculate the beta is to calculate it yourself with the combination of time frame and index which will be right for your calculations.
Author Sagar Vikmani Team Member – Equity Research and Valuation (M.Sc. Finance, NMIMS – Mumbai. Batch 2018-20)
Batteries are going to be the picks and shovels of the future business that are data driven and electrified. 5 years from now the electrical grid is going to be materially different compared to what we have today and the electrical vehicle business is going to be robust. There is increasing demand for batteries and their primary element the lithium ion. Essentially it uses the element lithium ion, to capture electrical particles and turn them to useable power.
Over the course of the next 5 years the battery segment it is well poised to grow at the rate of 10 to 15 percent sustainably over the next 10 years. In terms of where we are seeing this, different companies are tying up and recognising the importance of batteries – in June 2018 GM and Honda announced a partnership that Honda is going to buy battery modules from GM as they are looking for better performance and longer range. Like how the transportation segment revolved around the “fuel economy”, in the coming years the move is towards the “battery economy”. The better you make a battery, the better you can make an electrical vehicle – and the same is true for anything that has battery at the heart of it – data centres, grid, or even a corporate head quarters (where a lot of data is stored, power is required and the electric generator that is used are powered using advanced batteries). This is all a part of a much bigger movement, to make an effective and efficient use of electricity and how we do business in the future.
Leading up to today we see more demand for smart phones, stationary storage is catching up, but the EV’s are going to be the drivers of demand of battery (Goldman Sachs projects about 55% of the lithium ion battery market will be controlled by EV in 2020). Batteries are going to emerge as a really important part of the economy for both energy production and transportation.
What exactly is a battery?
The simplest definition can be that it is a device that is able to store electrical energy in the form of chemical energy and convert that energy into electricity. There are different chemical substances in the battery, which then exchange electrons across the battery cell which then exchange energy. The main components are the cathode the positive terminal of the battery, the anode the negative terminal of the battery and the electrolyte. The electrons flow from the anode – the negative terminal of the battery, towards the cathode – the positive terminal of the battery creating a closed circuit.
The most popular battery for all application today is the lithium-ion battery. The lithium is the martial which is in the cathode, used to exchange electrons across the system.
The lithium ion battery has become the default go-to for battery manufactures. First of all there is a fair amount of lithium available; it is very light and thin. It can hold its charge, for a substantial amount of time when compared to the lead acid or the classic alkaline battery. When you charge a lithium ion, you can be fairly secure that the charge you put in, most of it is going to stay there. The classic alkaline battery is not rechargeable, and the lead acid battery which is rechargeable, but requires constant recharging as it discharges easily.
The next question that arises is the availability and the production of lithium which can be in 2 ways – from Brian ponds predominantly from South America – Chile & Argentina. The second is from mineral rocks predominantly from China, Australia, Portugal and Zimbabwe.
The lithium is extracted through normal evaporation from Brian pond as it is the cheapest and the simplest way, but it can be time consuming. When mining it from mineral rocks, there is higher concentrated amount of lithium but it is more expensive and has environmental impacts.
CHINA’S CHOKEHOLD ON BATTERY – SUPPLY AND DEMAND
China wants to push toward cleaner energy, due to their air condition and their population. They have weak supplies of hydro carbons such as oil or natural gas and are depended heavily on Russia and the Middle East for oil, but have a robust lithium reserve, dominating global markets. In home market lithium ion is key for EV, as it vital for them to have large amounts of native production.
China has a huge reserve of lithium; most of it is in the form of mineral rocks, for producing lithium. Several native Chinese companies are using this to their advantage and making their names in the lithium ion business. Tianqi lithium recently paid nearly $4.3 billion, to become the second largest share holder in Chile’s SQM mining company one of the largest lit aggregators and producers of lithium in the world.
China very well positioned, having a controlling stance over lithium by making investments in South America and Australia and get a big bite out the market outside China as well. They have not dived into their own reserve, as they have locked up supplies elsewhere.
Being the largest consumer of lithium as well as the producer, China really controls both the demand side as well as the supply side.
Cobalt is a very important component for a battery; it helps in maintaining the longevity, stability and safety of the battery. If we reduce the level of cobalt in the battery, we need to increase the level of nickel, which increases risks of overheating and fires. It is expensive and expected to increase in demand between 10 and 25 times from current levels by 2030 with over 50% of the demand coming from battery segment. About 2/3 rd of the global supplies comes out of Congo.
Again when it comes to Cobalt, China has a significant position controlling 8 of the 14 largest miners in the Congo. China also accounts for 80% of the production of cobalt related chemicals, the chemical required to take the metal of the ground refine it and make it useable for the battery. China’s position in cobalt and layering it on lithium, locks-in both the supply and the demand side for the lithium ion battery.
As we look at different ways to produce cathode to go with lithium anode there is a strong interest in moving away from the strong holds that China has built up reserves around. Anode is predominantly graphite, which by surprise China had around 65% of the global production in 2017. Of the cathode and anode side, China had a major presence.
In the anode side, there have been explorations, works have been going on to replace graphite with aluminium, as it can hold more lithium, but any of these technologies have not reached commercial scale right now.
Important take away from the macro perspective is that as we look out in the battery market in the next 3-5 years, it’s going to run through China.
The leading EV battery formula that’s being used right now – nickel-manganese-cobalt-oxide cathode, China controls 57 % of their production. When it comes to the significant control of the inputs lithium, cobalt, when it comes to the refining capacity of the cobalt, they have 80 % of that capacity. On top of that, having a majority share of manufacturing of the cathodes that go into the manufacturing of lithium ion battery and over about 40% EV demand (source: IEA), IEA is projecting for China to control by 2040. When you are controlling all the steps in the value chain, from the rock coming out of the ground, all the way down to an EV driving of the lot, at least in the near term China is going to have a very important role to play.
Indrajith Aditya Team Member – Equity Research and Valuation (M.Sc. Finance, NMIMS – Mumbai 2018-20)
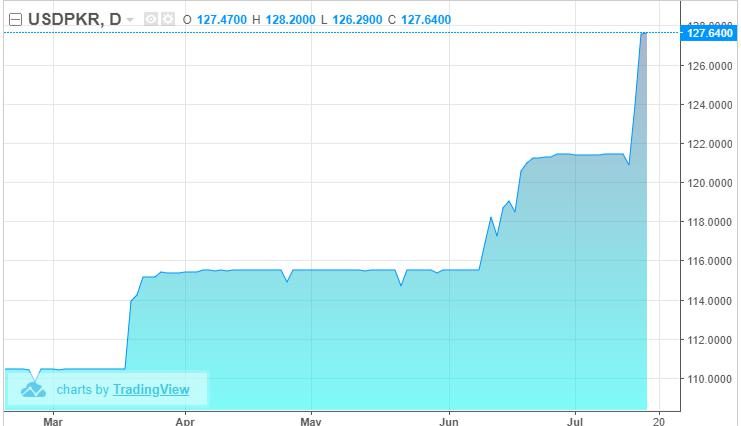
Pakistan’s fiscal and monetary conditions have only worsened in the past few years leading to the devaluation of the currency by as much as 15% YTD (2018).
Let’s look at a few charts that matter:
When a country devalues its currency their goal is to spur export growth by making their goods & services cheaper and curtail high imports.
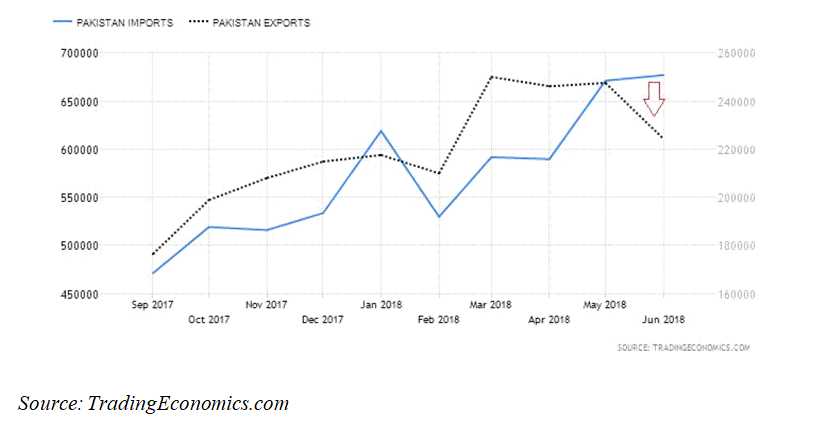
However, in case of Pakistan, the imports have remained elevated and exports have slowed down considerably even in the event of devaluation.
Post devaluing the PKR 3 times this year (2018), the imports have remained stubborn at 676 PKR billion whereas exports plunged from around 250 odd PKR billion to 224 PKR billion, down to pre-devaluation levels.
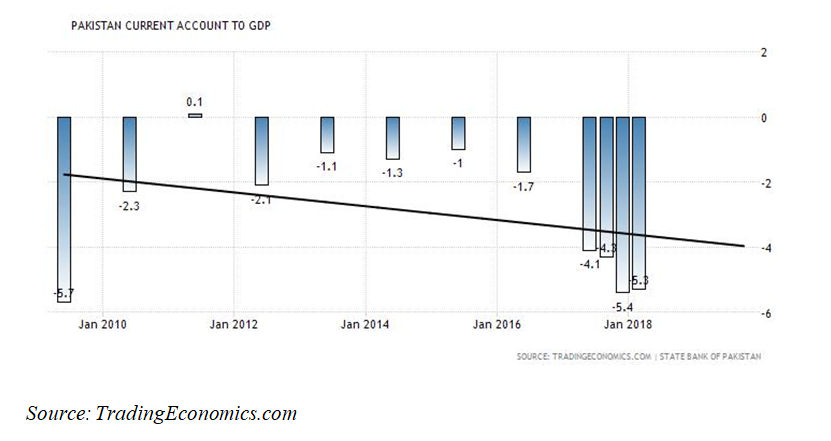
As a result, the country’s CAD or Current Account Deficit has deteriorated to unhealthy levels, the lowest since 2010.
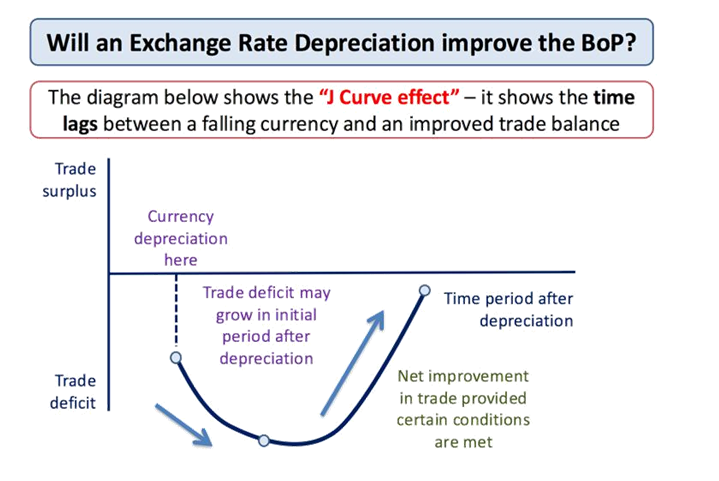
Maybe we owe this divergence in import-export to the so called Michael-Lerner Equation & the J curve effect?
The concept states that currency devaluation’s initial impact is a worsened BOP as there’s usually a lag between the pickup in exports (drop in imports) and devaluation.
The economy takes some time in order to structurally shift and realize that the imports are now expensive (so reduce them) and the exports are cheaper (so importing countries find it attractive and import more).
Whether Pakistan’s exports are still competitive considering its peers is another question.
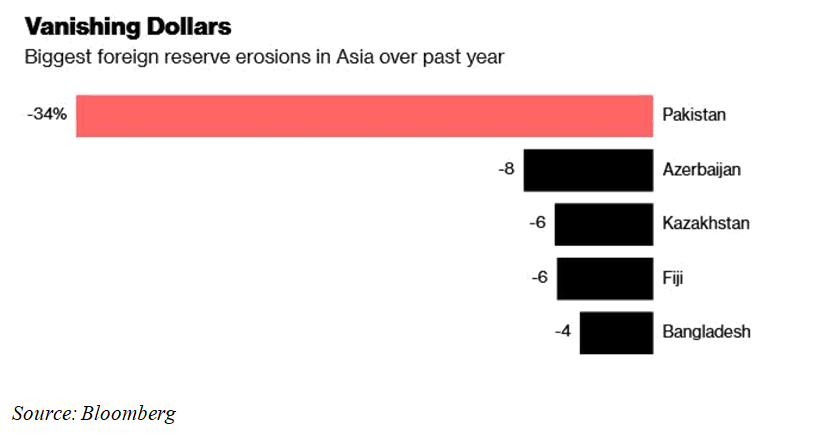
Now the natural impact of this is on the FX reserves, which have dropped sharply amid rising oil imports, lower FDI, higher debt burden, rising US interest rates and the list goes on. (with the China CPEC also putting a strain on the country’s BOP)
Here’s a chart by Bloomberg:
Although, the condition is not as worse as in Argentina, Turkey and the like where the outflows have been much higher, this is also worth noting.
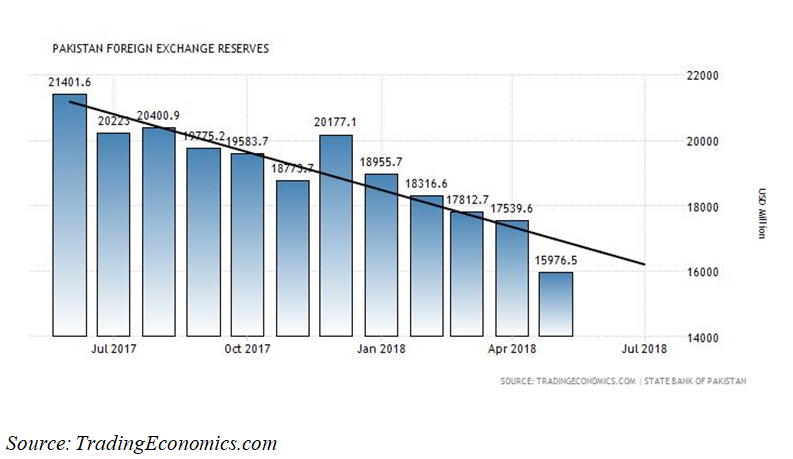
Here you can observe that the FX reserves have been declining consistently and have almost halved from their 2015 peak of around $24 billion to around $15.9 billion currently, reducing their import cover.
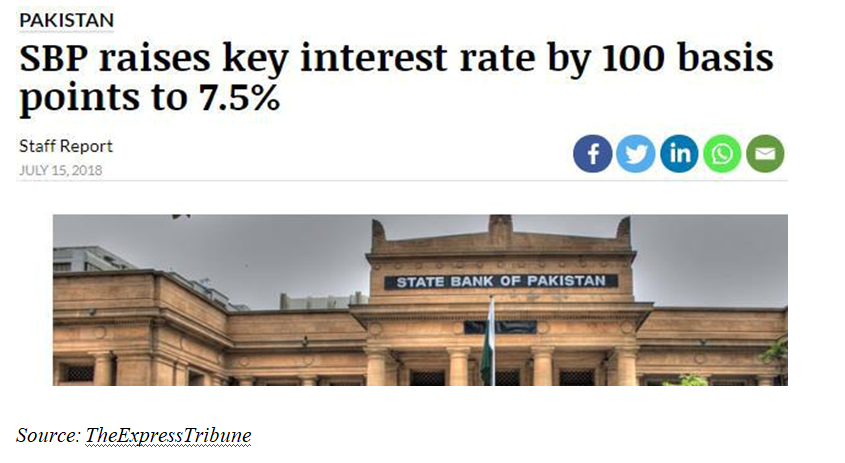
Pakistan’s real reserves have dropped below the level reached when the country approached IMF the last two times for a bailout, according to Bilal Khan, a senior economist at Standard Chartered Bank Plc. With elections scheduled for July 25, the next government will need to approach the IMF as a “matter of urgency,” said Khan. (Source: Bloomberg) This has thus, lead the State Bank of Pakistan (SBP) to hike rates by almost 100bps (175bps YTD).
Will this able to reverse the flows, reduce CAD (Current Account Deficit) and stabilize the economy with the backdrop of vanishing dollar liquidity and tightening monetary conditions across the globe? Maybe not.
Will we look at an International Monetary Fund (IMF) bailout? IMF is largely influenced by the US and with the on-going tensions between Washington and Beijing; an IMF bailout will be a less likely option for Islamabad.
President Trump probably believes that it would not be in the interest of US tax payers (whose money is being used to fund the IMF) to bailout the Chinese bond holders who have lent money to Pakistan for their ambitious BRI (Belt & Road Initiative) and CPEC (China Pakistan Economic Corridor) projects.
Author Harsh Shivlani Team Leader– Fixed Income & Derivatives (M.Sc. Finance, NMIMS – Mumbai. Batch 2018-20)
Artificial Intelligence (AI) started as the branch of computer science that aimed to make the computers follow logical steps to do some of the basic functions that the humans perform using common sense and has evolved from imitation, extension, augmentation and finally aims to reach human-level AI. In 1956 John McCarthy used the coinage ‘Artificial Intelligence’ and proposed a summer research project on the subject at the Dartmouth college involving scientists of psychology, mathematics, computer science and information theory; marking the beginning of AI as a science and engineering of making intelligent machines and recognizing it as a field of research. Technologies driving AI have since evolved from conventional programming using logical steps, heuristics using neural networks, machine learning using big data analytics to the ability of self-evolution. As a part of AI, machines simulate human intelligence processes like learning (acquire information and the rules for using that information), reasoning (using rules to reach approximate or definite conclusions) and self-correction to find application in expert systems, speech recognition and machine vision.
Kai Fu Lee classifies AI revolution in four waves. The first
wave was the internet AI which began about 15 years ago but matured around 2012
and was mostly about using AI algorithms as recommendation engines. Some of the
common applications of these are in recommending streaming videos in YouTube
and likely next purchase on Amazon. Many users find internet experience getting
better and becoming addictive often because of a successful AI recommending
algorithm working in the background. Companies like Google, YouTube, Baidu,
Amazon and Alibaba made substantial financial gains using internet AI. Another major
application of internet AI is in using algorithms as editors giving real time
news that is customised to a user, digital reporter and a virtual robot cop
that reports fake news.
The
use of neural networks, Deep learning and Machine learning in financial
services has recently exponentially gone up, with there being “Robo-advisor’s”,
such as “Wealthfront”. Traditional
financial advisors have high fees, minimum account balances etc. However, in
“Wealthfront”, they use risk assessment algorithms to ascertain risk and create
highly individualized plans. The created portfolio is also continuously
monitored and periodically churned to give the highest return.
The
use of neural networks is also used to find cointegrated pairs for pairs
trading. As after implementing a rolling Beta, the pair which was once
cointegrated for a time period might not be so in the future and might not mean
revert. And using machine learning on previously cointegrated pairs that
stopped mean reverting.
Even
Bank Of America Merril Lynch is implanting enterprise software fintech
HighRadius’s Artificial Intelligence solution to speed up stock receivables
reconciliation for the banks big business clients. While, some might look at
Artificial Intelligence as a path to a brighter future with greater efficiency.
There are others like Elon Musk, who refer to the future of Artificial
Intelligence as an “immortal dictator”. This might sound hypocritical
of him as he created an AI that defeated some of the best DOTA 2 players in the
world. This is one of the greatest milestones that AI has ever crossed. IBM’s
Deep blue computer defeated one of the best chess players in the world Garry
Kasparov in 1997. And In 2016, AlphaGo defeated Lee Se-dol at the board game
Go. This further pushed China to peruse AI as the board game GO which was the
pride of China.These fears regarding AI are not applicable to the use in
Finance; As they are not true while using “narrow AI”, such as in Financial
Services.
The second AI wave was the business AI, that makes use of legacy systems data that was already being labelled and stored by traditional companies like the insurance companies covering data on accident claims and frauds, banks on loans and repayment rates, hospitals on diagnosis and survival rates etc. and structured corporate data like historic stock prices, credit card usage, mortgage defaults etc. Early instances of business AI have clustered heavily in the financial sector because it naturally lends itself to data analysis since it runs on structured information and has a clear metric that needs to be optimized. AI, therefore, is ideally applied for optimization for maximisation of the bottom line.
AI finds application in computational finance where an automated intelligent agent is applied for pattern recognition and use it to discover patterns in the stock prices for accurate prediction. Although major companies like Palantir and IBM offered big-data consultancy since 2004, major capabilities in the field emerged after the adoption of deep learning in 2013. Companies like Element AI of Canada and 4th Paradigm of China entered the competition offering algorithms that could mine the data of traditional companies and organizations to improve fraud detection, make smarter trades and uncover inefficiencies in supply chains to use AI for cost savings and profit maximisation.
Whilst there are several credit cards and mobile payment applications that are popular and prevalent, their core services limit spending. An AI powered micro finance app called Smart Finance in China relies exclusively on an algorithm to make millions of small loans. The deep learning algorithm uses a wide range of information including offbeat information like the speed at which the user types his date of birth or the amount of battery power left on the phone etc. of the user from his mobile to predict the repayment potential and authorise loans. In late 2017 the company was making more than 2 million loans per month with default rates in low single digits which outperform many traditional brick-and-mortar banks because it targeted a large user base of potential micro-finance seekers that was ignored by the traditional banking sector – the young and the migrant workers.
The other major applications in the second wave of AI are the use of algorithms for expert medical diagnostics and for legal advice to the judges based on deep learning. The 3rd AI wave is the perception AI where the distinction between the real and the virtual world are being increasingly blurred and digital assistants and Augmented as well as Virtual Reality applications are being introduced. The 4th AI wave is about autonomous vehicles like self-driving cars and autonomous robots to be employed in workplaces. The 3rd and the 4th waves are still in emerging phases but are fast expanding.
Author Neil Jha Team Leader – Fintech (M.Sc. Finance, NMIMS – Mumbai. Batch 2018-20)